#10 Sousveillance Tool
Dumpster dive
You can view my code here:)
Description
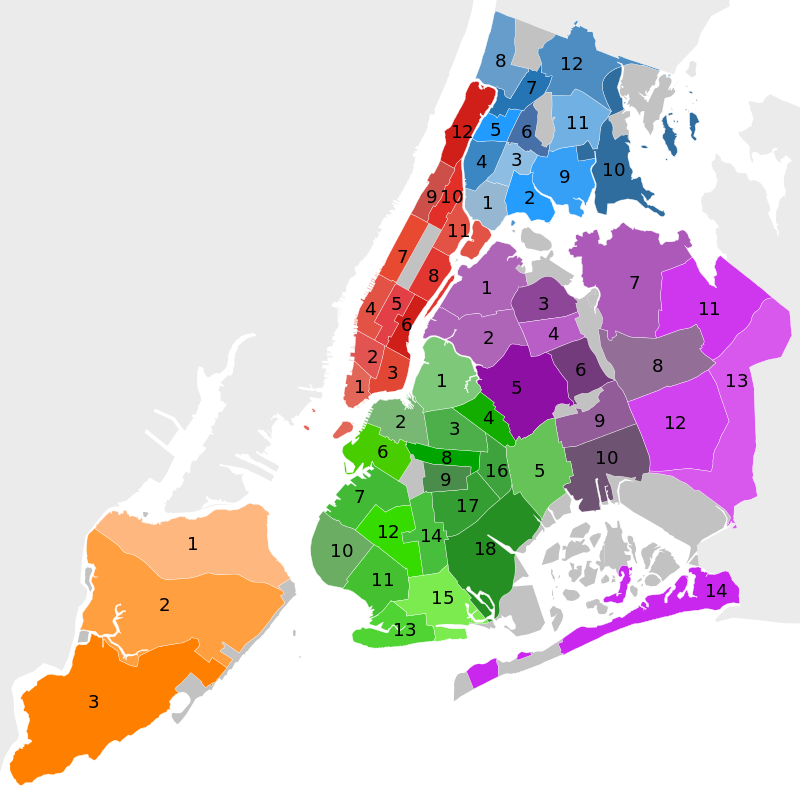
A very common sight in New York City - giant piles of trash lining the streets, patiently waiting along with their rat friends for pickup day. What is in these bags? Where do the contents go? How much do they weigh? How are they sorted? This tool allows users to view the amount of trash generated that particular month in each community district in each of the 5 NYC boroughs. I sourced the Monthly Tonnage Data API from NYC Open Data, provided by the Department of Sanitation, New York City. Currently the tool displays data for Dec 2021. It will be updated monthly.
Design Process
This assignment reminded me of doing a giant, truckload pile of laundry. I usually reserve Thursday evenings to do my laundry and very ironically, I ended up working on a large chunk of this code on a Thursday. I have never in my life sorted something so much and I knew I needed to be smart about it. The API stores data for each month for each of the 59 community district as a seperate endpoint, creating a fairly large dataset with over 20,000 rows. To limit the amount of data I was e was extracting and to keep the sousveillance tool relevant to the present, I decided to extract only the current month data. This was done by creating a string using the month() and year() functions that take the computer taime and year as inputs. This string was added to the url string to get a more specified dataset. Fortunately,the NYC Open Data platform was convenient to use and understand, with clear instructions on how to access the various fields and filtering.
Reflection
I initially wanted to work on public parks or community gardens as I've been interested in the secret gardens of the city. This topic also aligned with my Major Studio 1 research inquiry. I was also curious about trash collectin throughout the city. I found an API on Daily Tasks Park Cleaning Data that felt like a good convergence between my two interests. However the dataset was endless with over 500 million rows and the information seemed more useful to track the management of parks, rendering it useless to a third person New Yorker. Viewing and analysing this data through a feminist lens didn't really work either.
The assignment gave me an opportunity to learn more about how the city is divided into boroughs, and further into community districts.
 Moreover, it was interesting to see how the trash collected is divided into refuse, recyclable paper, recyclable materials, leaves and in January, even Christmas trees.
Credits
This project was created based on the tutorials provided on the Critical Computation website, and the tutorials provided by The Coding Train.